
Charts
How to Create a Chart in Excel: the 5-step method for any chart
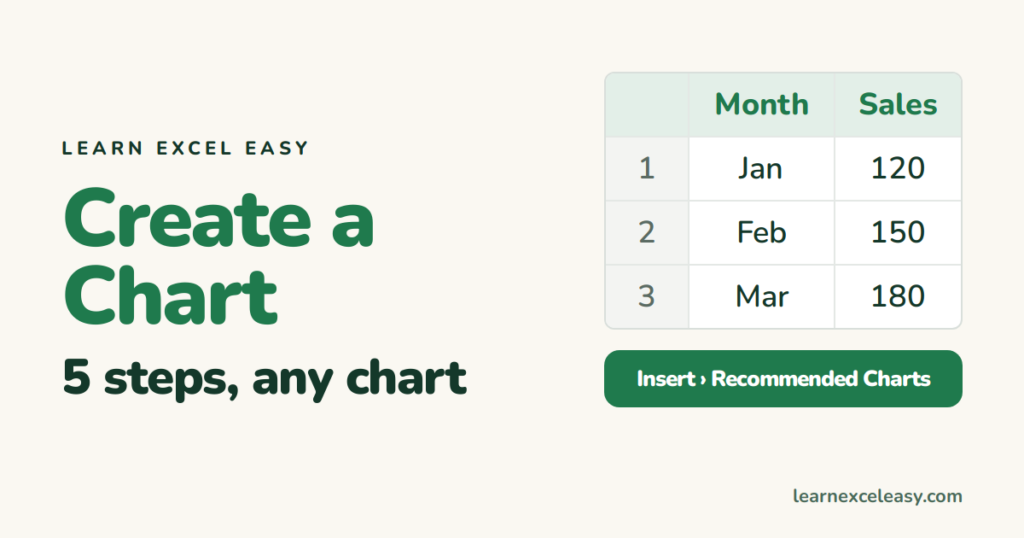
How to create a chart in Excel: arrange the data, select it, pick the chart type that fits, then title, label and tidy — the same five steps for every chart.
How to create a chart in Excel: arrange the data, select it, pick the chart type that fits, then title, label and tidy — the same five steps for every chart.
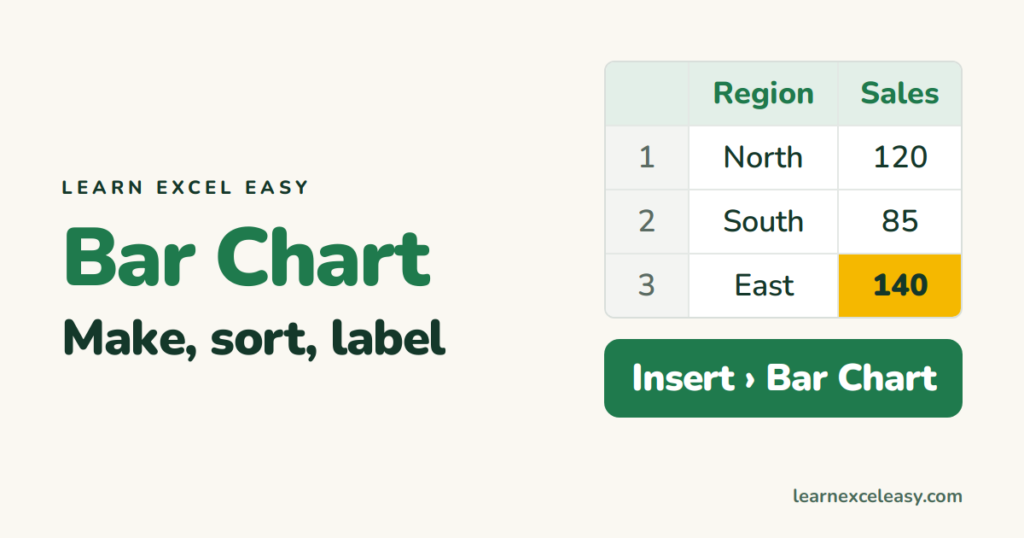
Make an Excel bar chart in four steps, put the biggest bar on top, add data labels, change the colour of one bar, and choose bar vs column.
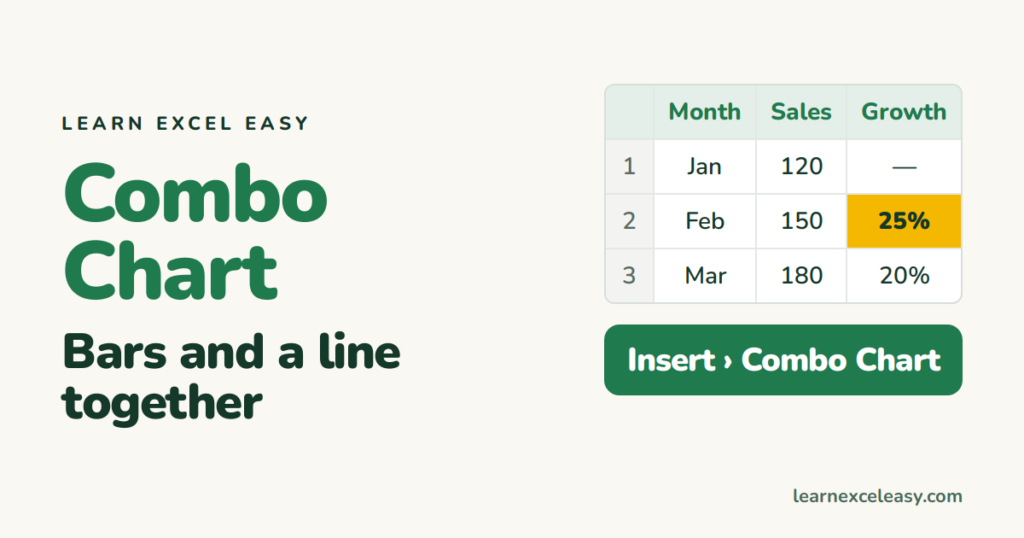
Make an Excel combo chart: sales as bars and growth % as a line on a second axis, in five steps, with the two settings that make it readable.
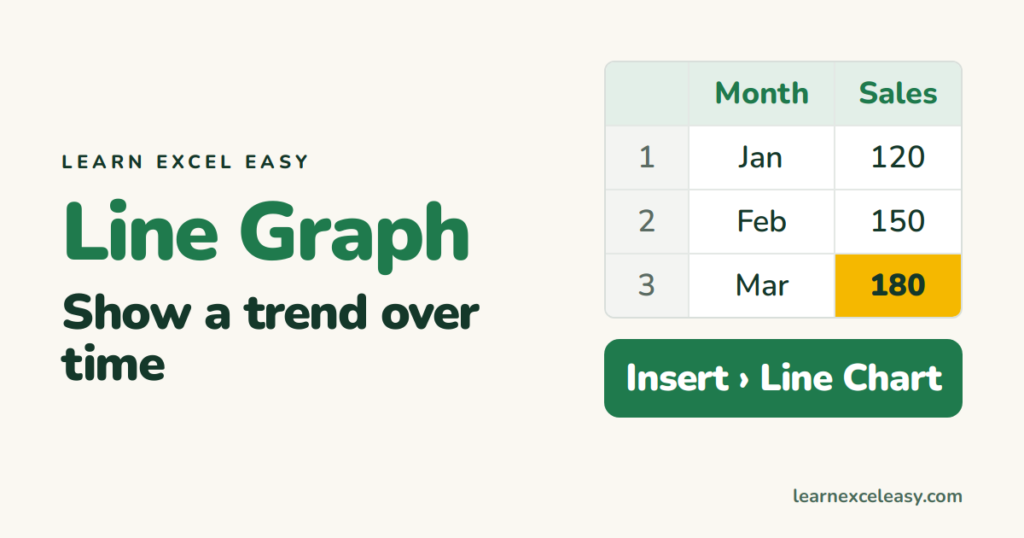
Make an Excel line graph in four steps, add a second line, fix the axis that starts at the wrong number, and add data labels.
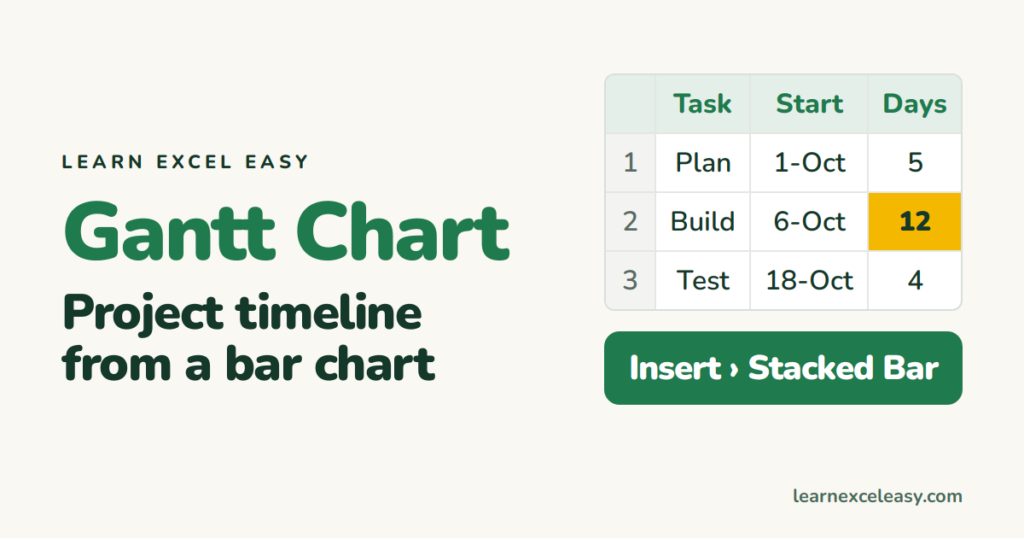
Build an Excel Gantt chart in eight steps from a stacked bar chart: tasks, start dates, durations, and the one trick that hides the first bar.
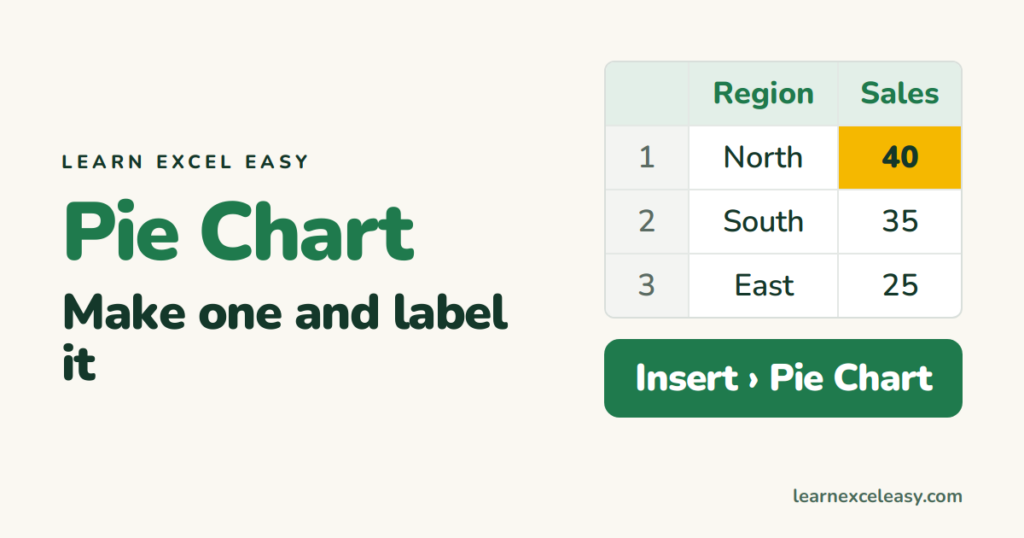
Make an Excel pie chart in four steps, add percentage labels, and know when a bar chart is the better choice.
One short Excel lesson in your inbox every morning. Free, no spam, unsubscribe any time.
Also join us on Facebook
