
Charts
Excel Charts and Graphs: the complete beginner’s guide
Excel charts and graphs for beginners: chart vs graph, the parts of a chart, how to make one in 5 steps, the 6 types you need, and the fixes for the common problems.
Excel charts and graphs for beginners: chart vs graph, the parts of a chart, how to make one in 5 steps, the 6 types you need, and the fixes for the common problems.
Import an Excel file into Google Sheets: upload and convert, open .xlsx directly without converting, what survives the trip, and keep a Sheet updated from Excel.
Turn an Excel range or chart into an image: copy as picture, save a chart directly as PNG, take a high-resolution screenshot, and paste into email or slides.
Make one pivot table from several Excel sheets: stack the sheets with Power Query Append, then build the pivot — and the older Data Model way.
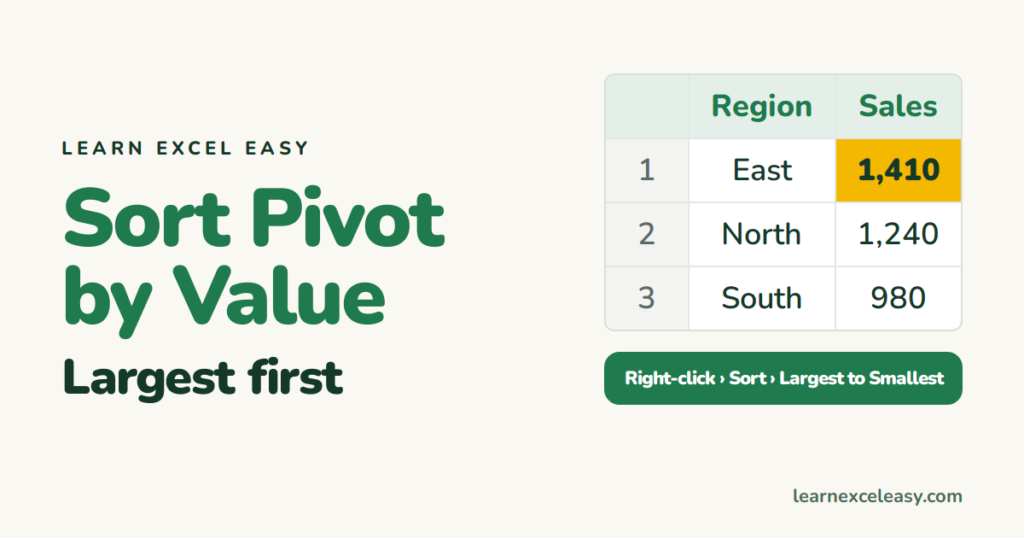
Sort an Excel pivot table by its values — largest to smallest — with a right-click, sort a specific column when there are several, and keep the sort after refresh.
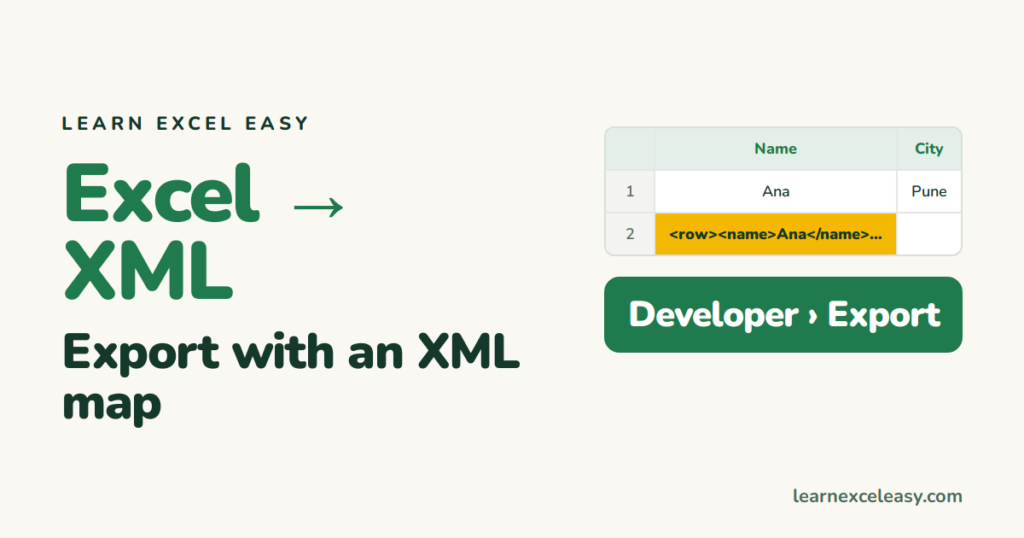
Export Excel to XML with an XML map, the quick way for a simple list using the Developer tab, a formula-built XML for small sheets, and importing XML into Excel.
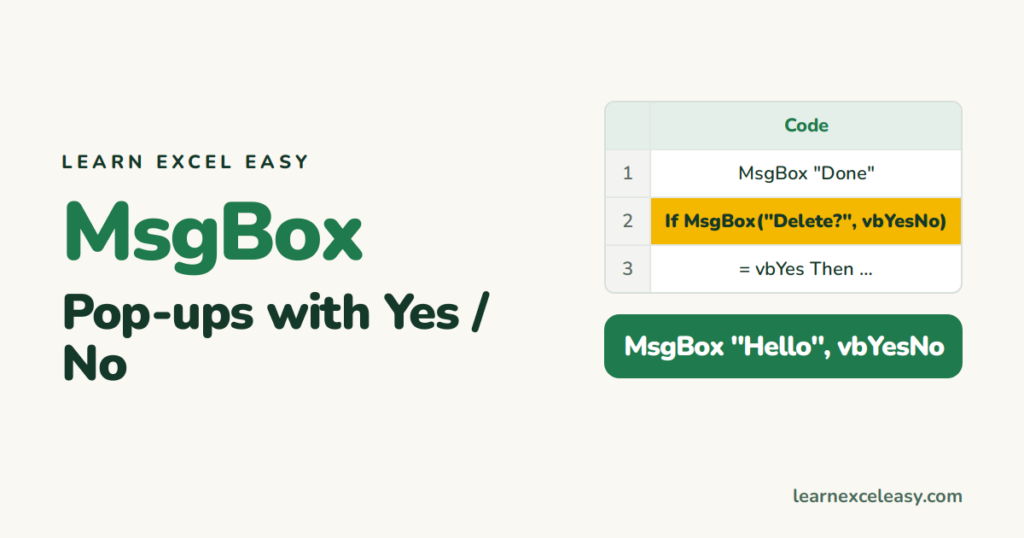
Use MsgBox in Excel VBA: a simple message, an icon and title, Yes/No buttons that change what the macro does, and a message with a cell's value in it.
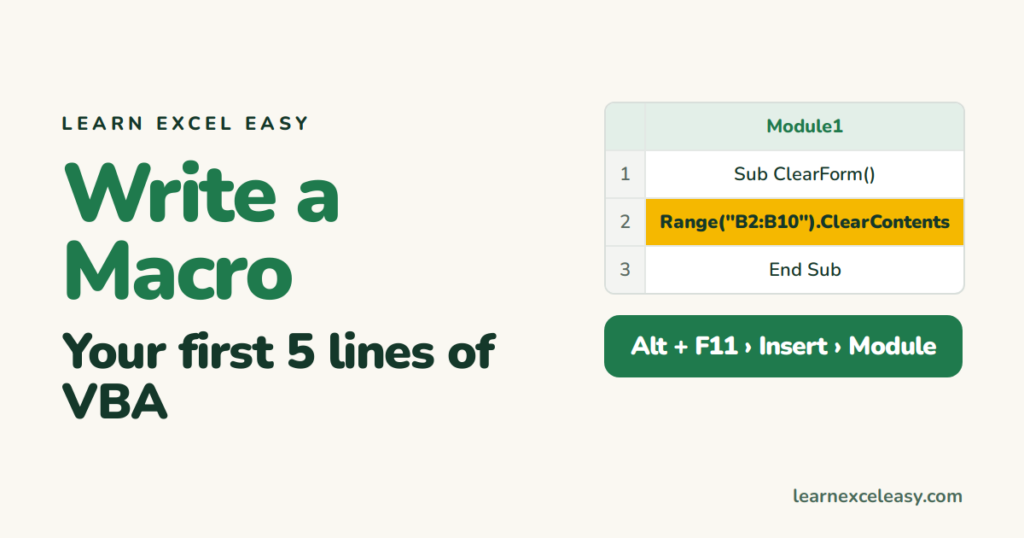
Write a macro in Excel by hand: open the editor, write a Sub that clears a range and adds a date stamp, run it, give it a button, and save it.
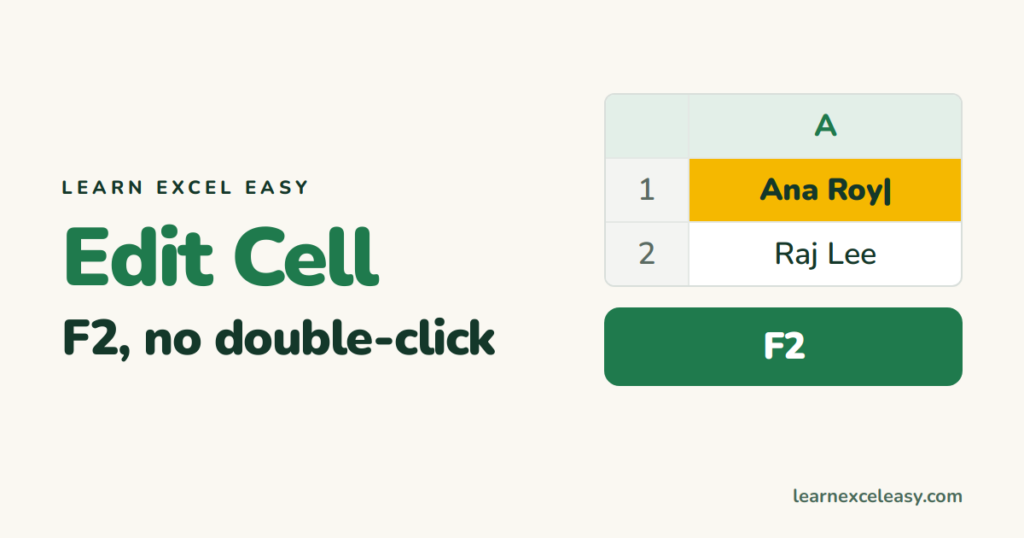
Edit a cell in Excel without double-clicking: F2, then Home/End and Ctrl+Arrow inside the cell, replace the whole cell, and add a line break.
One short Excel lesson in your inbox every morning. Free, no spam, unsubscribe any time.
Also join us on Facebook
