Excel Pivot Table: the complete guide (build, group, filter, refresh)
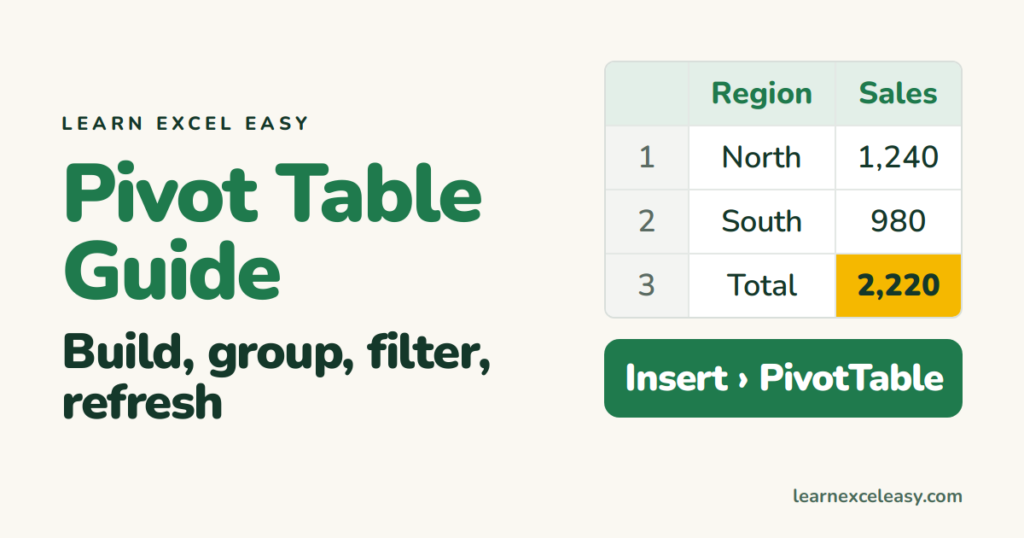
Everything about Excel pivot tables in one place: build one, rows and columns, sum vs count, group dates, filters and slicers, sort, calculated fields, refresh, and the mistakes.
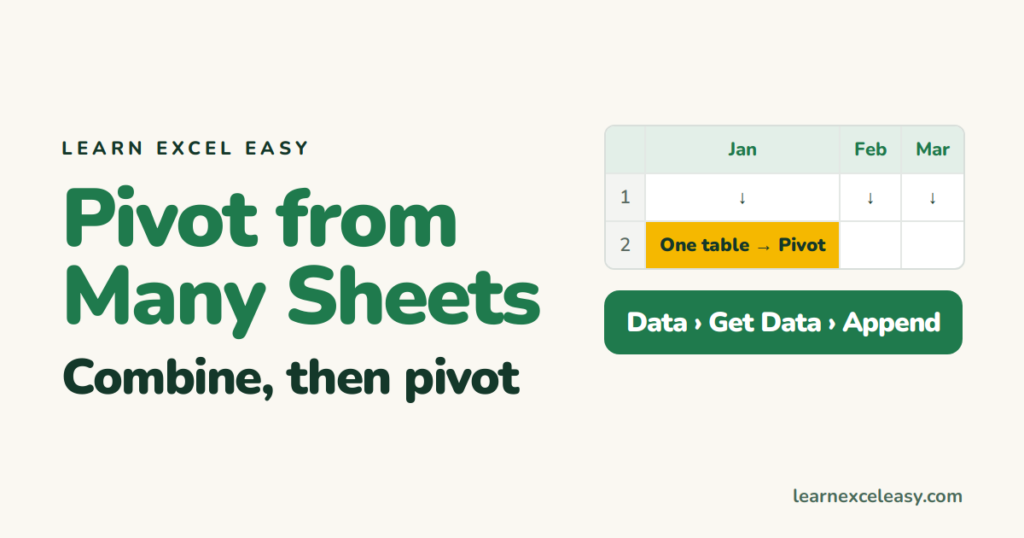
Make one pivot table from several Excel sheets: stack the sheets with Power Query Append, then build the pivot — and the older Data Model way.
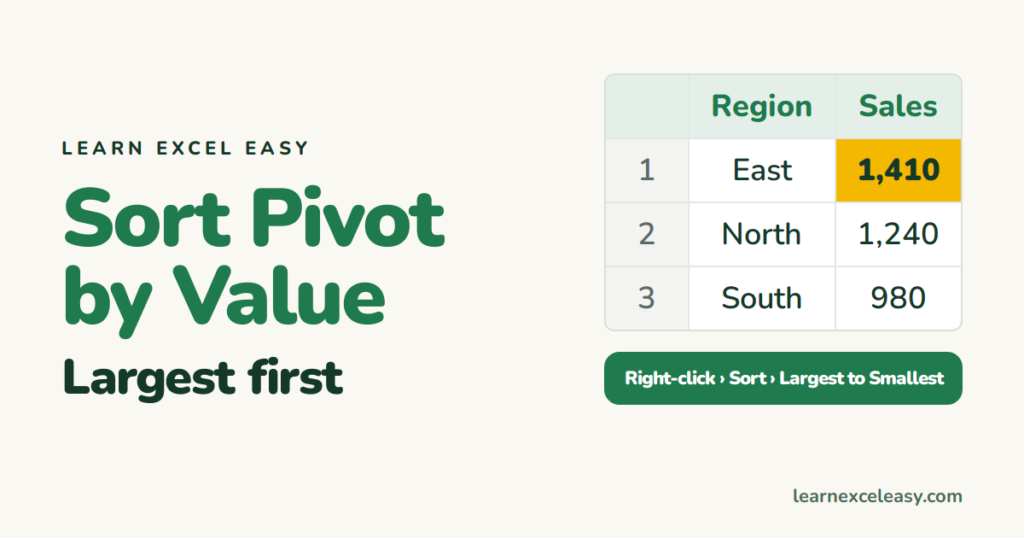
Sort an Excel pivot table by its values — largest to smallest — with a right-click, sort a specific column when there are several, and keep the sort after refresh.
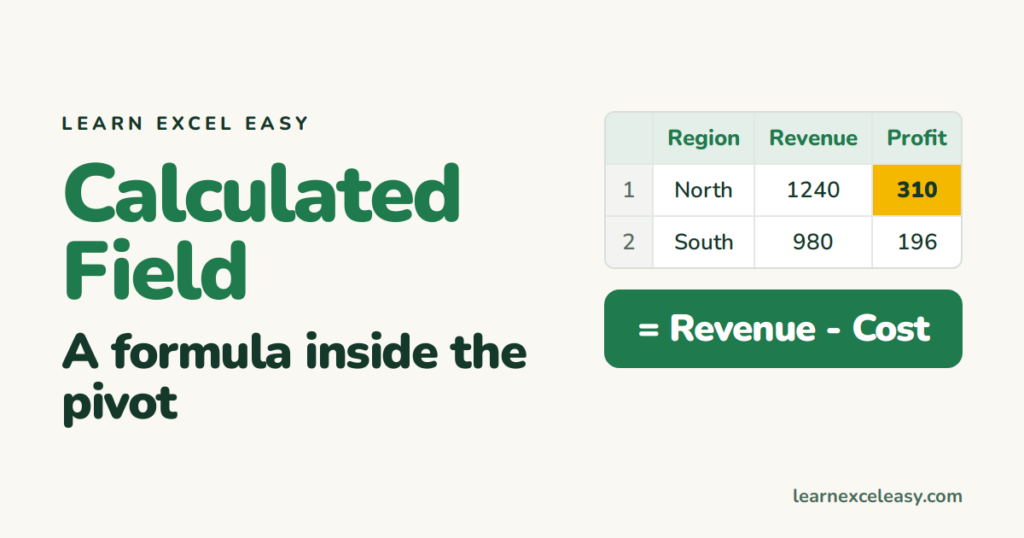
Add a calculated field to an Excel pivot table — profit from revenue and cost, margin %, price per unit — edit it, and know the case where it gives the wrong answer.
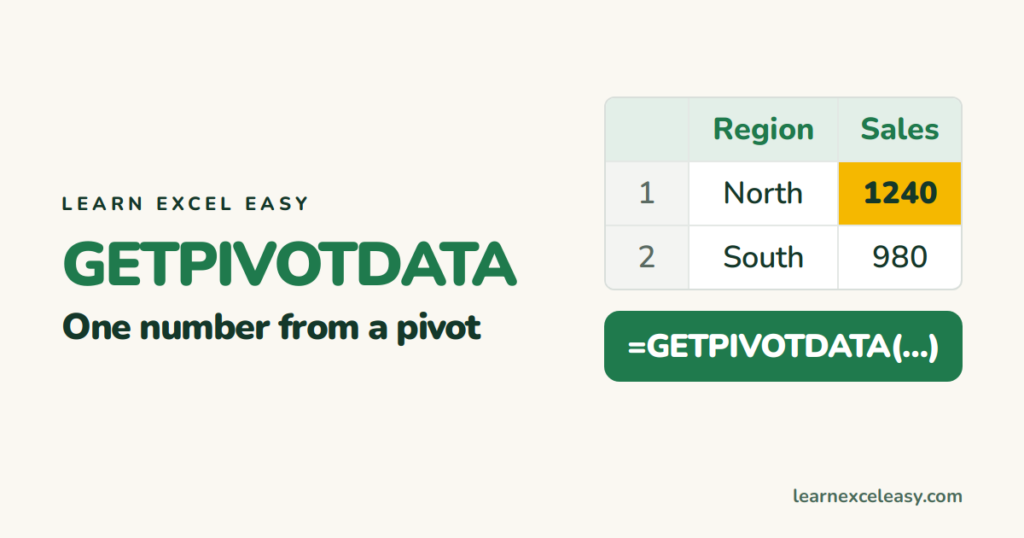
GETPIVOTDATA in Excel: what the formula Excel writes for you means, how to make it use a cell instead of fixed text, and how to turn it off if you just want =B5.
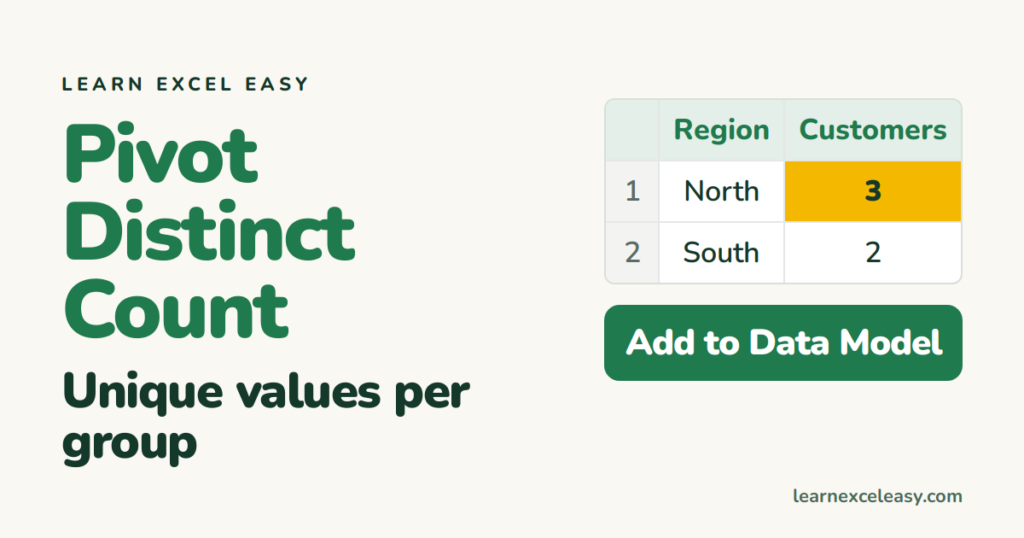
Count unique values in an Excel pivot table with Distinct Count — the one tick box when you create the pivot — plus the helper-column way for older Excel.
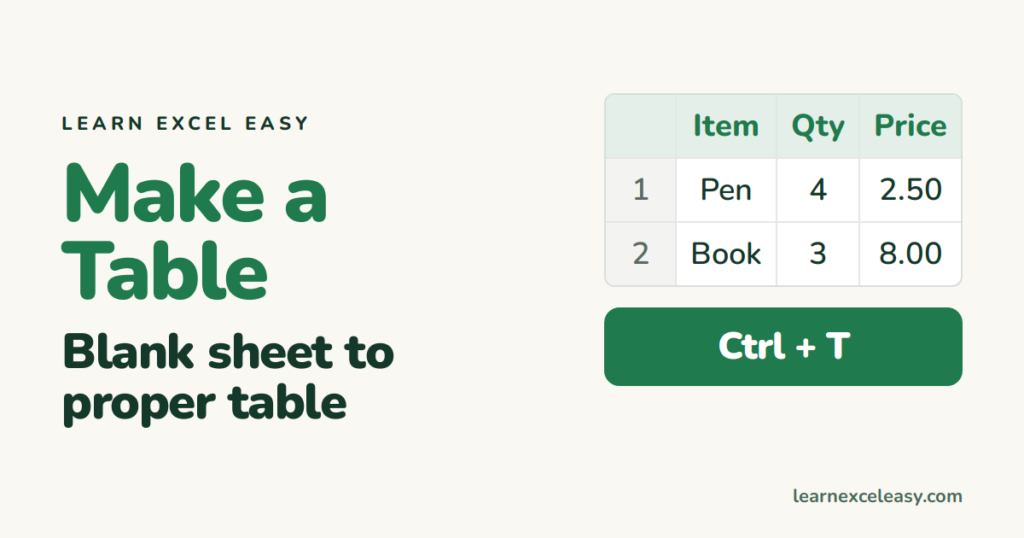
How to make a table in Excel from scratch: type the headings, enter data, press Ctrl+T, then sort, filter, total and style it.
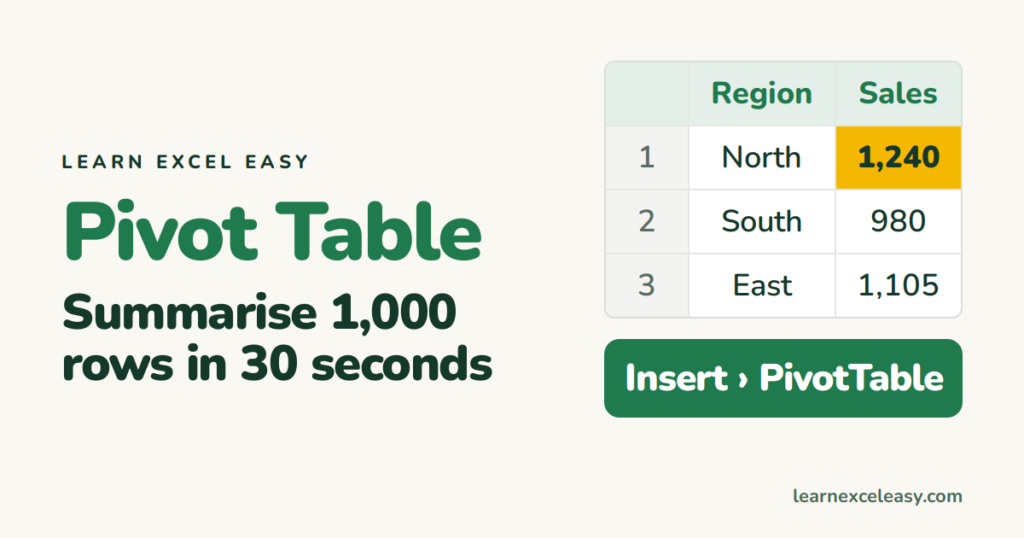
How to make a pivot table in Excel step by step: sales by region, count by category, drag fields, refresh when data changes.
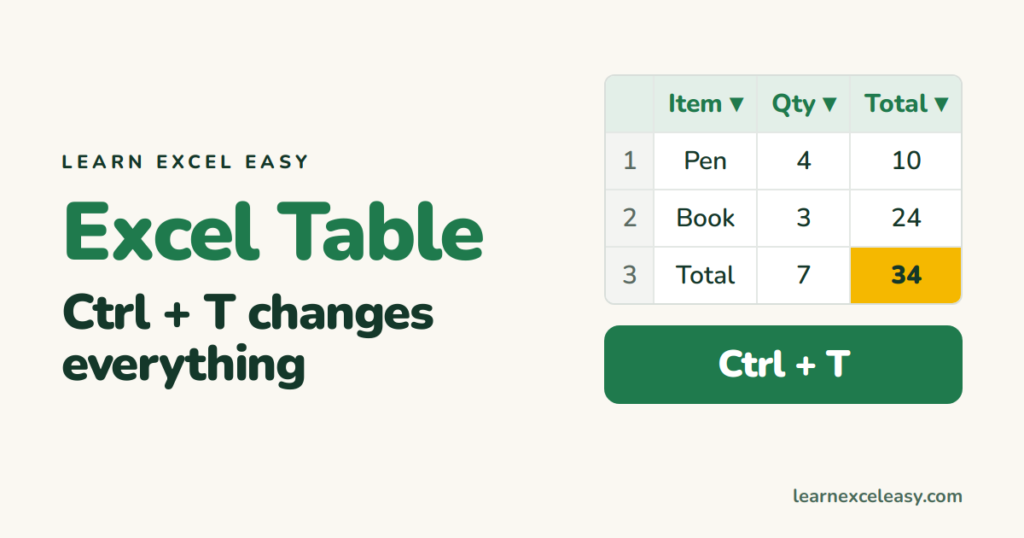
Turn a range into an Excel Table with Ctrl+T: automatic stripes, filters, formulas that copy themselves, and a total row.
One short Excel lesson in your inbox every morning. Free, no spam, unsubscribe any time.
Also join us on Facebook