
Excel Gantt Chart: build a project timeline from a bar chart
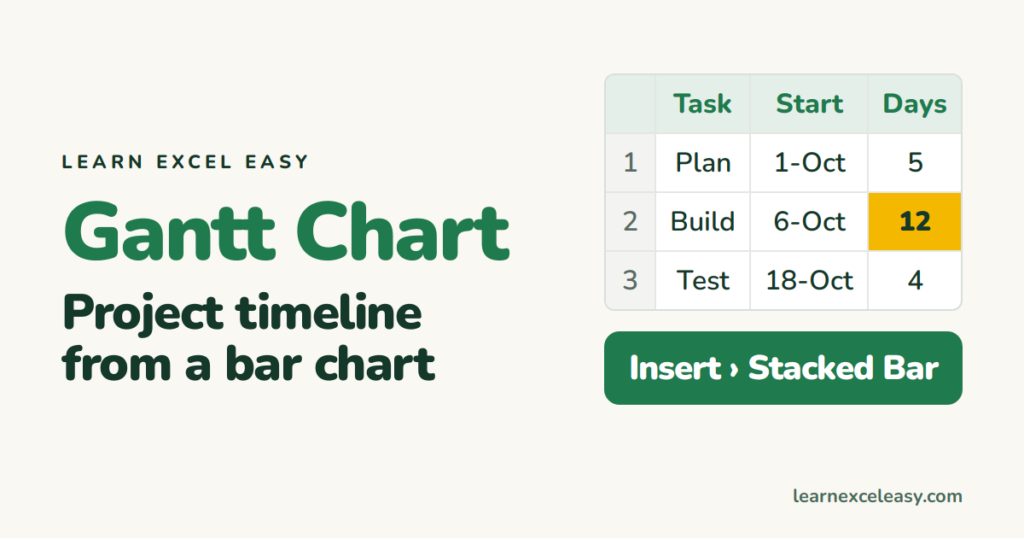
Excel has no Gantt button, but a stacked bar chart with the first bar made invisible is exactly a Gantt chart. Eight steps.
What you will make
A timeline where each task is a horizontal bar starting on its start date and as long as its duration.
Step 1: the data
| A | B | C | |
|---|---|---|---|
| 1 | Task | Start | Days |
| 2 | Plan | 1-Oct-2026 | 5 |
| 3 | Build | 6-Oct-2026 | 12 |
| 4 | Test | 18-Oct-2026 | 4 |
Start must be real dates, Days a number.
Steps 2–8
- Select A1:C4. Insert › Bar Chart › Stacked Bar.
- The task order is upside down. Click the task names on the axis › Ctrl + 1 › tick Categories in reverse order.
- Click any blue (Start) bar › Ctrl + 1 › Fill: No fill. Border: No line. The Start bars vanish, leaving Days bars floating at the right dates.
- Click the date axis at the bottom › Ctrl + 1. Set Minimum to your first start date typed as a number: select B2, look at the formula bar with General format — or just type the date and Excel converts it.
- Same panel: Major unit 7 for weekly gridlines.
- Click the legend, press Delete.
- Click the chart title, type the project name.
Check it worked
Plan should run 1–5 Oct, Build should start right after on the 6th. Change a Days value — the bar stretches.
Add today’s line (optional)
Add a column D with =TODAY() in every row, add it as a series, change that series to a scatter with a vertical error bar. Advanced — skip it on your first Gantt.
Common mistake
Dates typed as text (“1 Oct”). The chart puts them at zero. Retype as 1/10/2026 or 2026-10-01.

20 years with spreadsheets and enterprise systems. Writes one short, plain-English Excel lesson a day. Got an Excel question? learnexceleasycom@gmail.com
