
How to Add Error Bars in Excel (standard and custom)
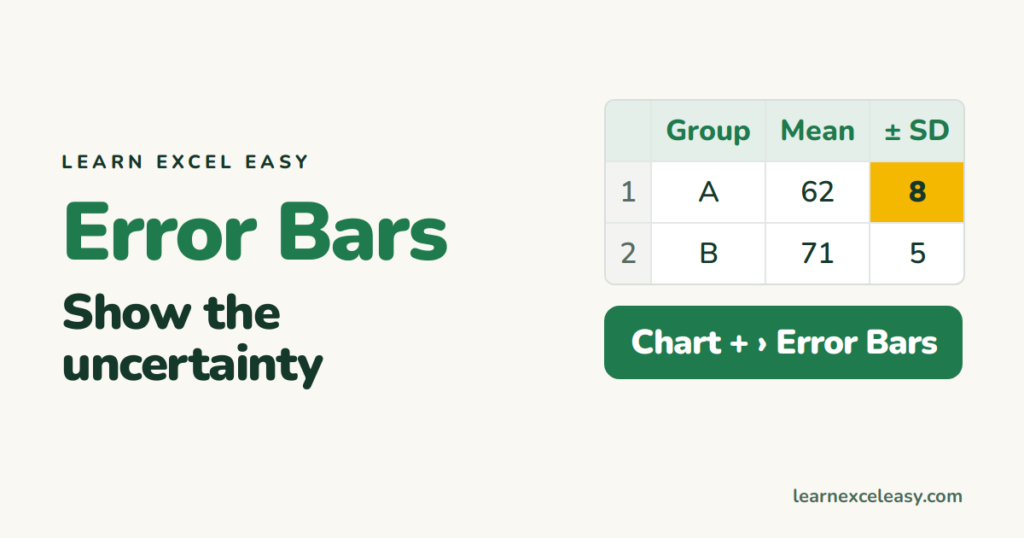
Error bars show how much a value might vary — usually the standard deviation or standard error.
Add them
- Click the chart.
- Click the + (Chart Elements) at the top-right.
- Tick Error Bars.
Mac: Chart Design › Add Chart Element › Error Bars.
Choose the type
Click the arrow next to Error Bars:
- Standard Error — the same for every bar, from all the data.
- Percentage — 5% of each value by default.
- Standard Deviation — one SD of all values, same for every bar.
Custom values for each bar (what most people need)
- Put each group’s SD next to its mean, e.g. C2:C4. Calculate it with STDEV.S.
- Error Bars › More Options.
- Error Amount › Custom › Specify Value.
- Positive: select C2:C4. Negative: select C2:C4 again. OK.
Standard error per group
=STDEV.S(B2:B20)/SQRT(COUNT(B2:B20))
Style
Format Error Bars: Direction (both, plus, minus), End Style (cap or no cap), line colour and width.
Scatter charts
You get horizontal and vertical bars. Click the horizontal ones and delete if you don’t need them.
Chart basics: create a chart

20 years with spreadsheets and enterprise systems. Writes one short, plain-English Excel lesson a day. Got an Excel question? learnexceleasycom@gmail.com
