
Break-Even Analysis in Excel (formula and chart)
The idea
Break-even is where sales exactly cover costs. Each unit sold earns price − variable cost (the contribution) toward the fixed costs.
Set up the inputs
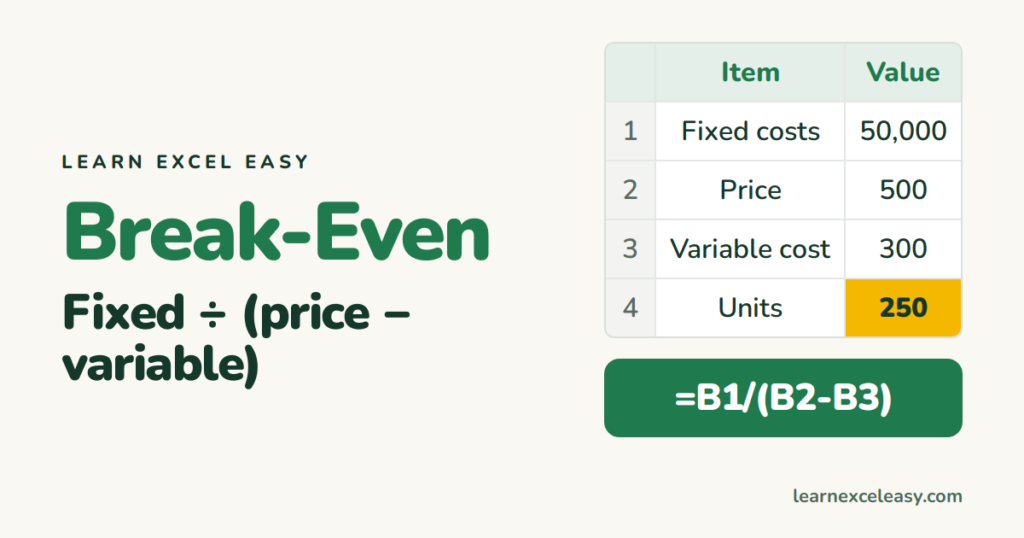
B1  Fixed costs per month   50000
B2  Selling price per unit    500
B3  Variable cost per unit    300
Break-even units
=B1/(B2-B3)
50,000 ÷ 200 = 250 units. Round up, since you can’t sell part of a unit: =ROUNDUP(B1/(B2-B3),0) — see ROUNDUP.
Break-even sales value
=B1/((B2-B3)/B2)
₹1,25,000 of sales.
Profit at any volume
=E2*(B2-B3)-B1
E2 holds a units figure. Negative = loss.
What-if: change the price
Try prices in a column and see break-even move, or ask Excel “what price breaks even at 200 units?” with Goal Seek. More in what-if analysis.
Break-even chart
- Make a column of units: 0, 50, 100 … 500.
- Revenue:
=A8*$B$2. Total cost:=$B$1+A8*$B$3. - Select all three columns › Insert › Line chart (or scatter with lines).
Where the lines cross is the break-even point.

20 years with spreadsheets and enterprise systems. Writes one short, plain-English Excel lesson a day. Got an Excel question? learnexceleasycom@gmail.com
