
What-If Analysis in Excel: Scenarios, Goal Seek and Data Tables
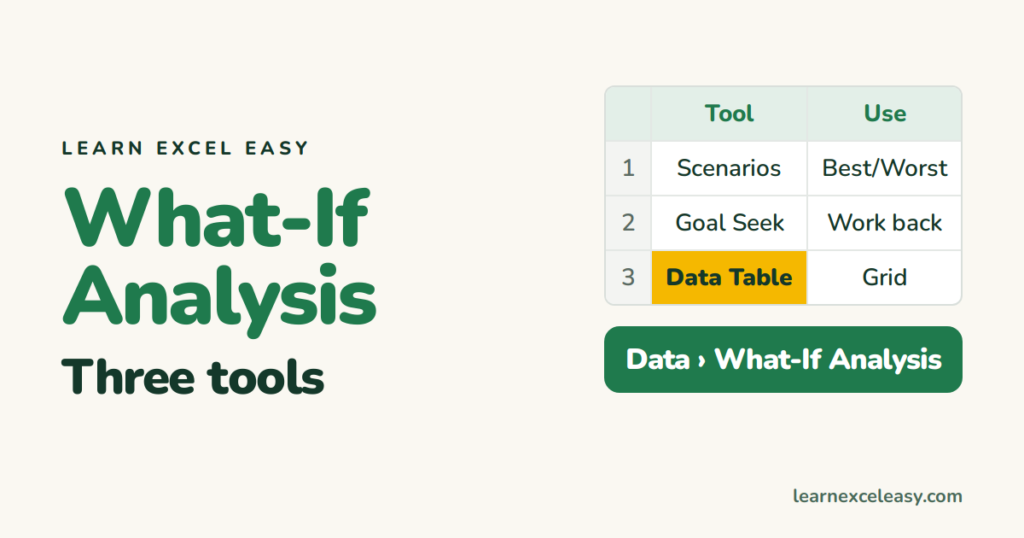
Data › What-If Analysis has three tools. They answer different questions:
| Tool | Question |
|---|---|
| Scenario Manager | What happens under Best, Expected and Worst cases? |
| Goal Seek | What input gives the result I want? |
| Data Table | What is the result for every combination of two inputs? |
Scenario Manager
- Data › What-If Analysis › Scenario Manager › Add.
- Name it “Best”, choose the changing cells (growth, price), enter their values. Repeat for “Worst” and “Expected”.
- Show switches the sheet to that scenario. Summary builds a report comparing all of them.
A lighter alternative: one input cell with a drop-down and CHOOSE.
Data Table (two inputs)
See the EMI for every loan amount and interest rate:
- Put the EMI formula in a corner cell, e.g. E2 (referring to input cells B1 = rate and B3 = loan).
- Loan amounts down the column below E2 (E3:E10), rates across the row to its right (F2:J2).
- Select E2:J10 › What-If Analysis › Data Table.
- Row input cell: B1 (rate). Column input cell: B3 (loan) › OK.
Excel fills the grid with an EMI for every combination. EMI formula: PMT.
One-input data table
Values down a column, formula one row above and one column to the right, leave Row input cell empty.
Tips
- Data tables recalculate constantly. If a big file gets slow: Formulas › Calculation Options › Automatic except for data tables, then F9 when needed.
- Input cells must be on the same sheet as the data table.
Many inputs with limits: Solver

20 years with spreadsheets and enterprise systems. Writes one short, plain-English Excel lesson a day. Got an Excel question? learnexceleasycom@gmail.com
