
Standard Deviation in Excel: STDEV.S vs STDEV.P
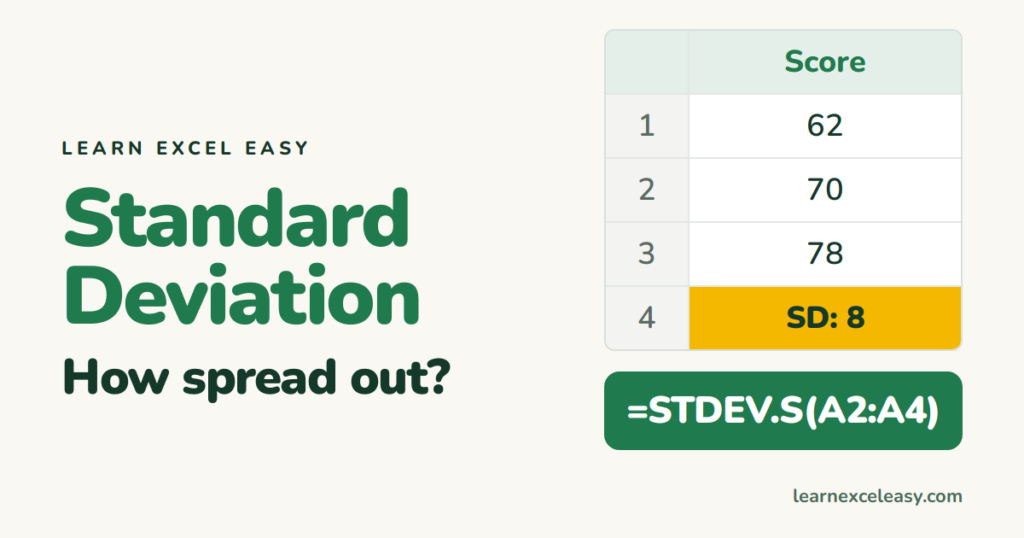
Standard deviation measures how spread out numbers are from their average. Small = bunched together. Large = scattered.
The formula
=STDEV.S(B2:B100)
STDEV.S or STDEV.P?
- STDEV.S — your data is a sample of a bigger group (50 customers surveyed out of thousands). Use this most of the time.
- STDEV.P — your data is the whole group (every employee in the company).
STDEV and STDEVP are the old names; they still work.
Reading the result
Average 70, SD 8: in roughly bell-shaped data, about two-thirds of values sit between 62 and 78, and about 95% between 54 and 86.
As a percentage of the average
=STDEV.S(B2:B100)/AVERAGE(B2:B100)
Format as %. This is the coefficient of variation — useful for comparing spread across different scales.
With a condition
=STDEV.S(FILTER(C2:C100,A2:A100="North"))
Text and blanks
Both are ignored. STDEVA counts text as 0 — rarely what you want.
Next steps
- Score each value against the spread: Z-score.
- Show it on a chart: error bars.
- Middle value: MEDIAN.

20 years with spreadsheets and enterprise systems. Writes one short, plain-English Excel lesson a day. Got an Excel question? learnexceleasycom@gmail.com
