
Excel Stacked Bar Chart: parts and totals in one bar
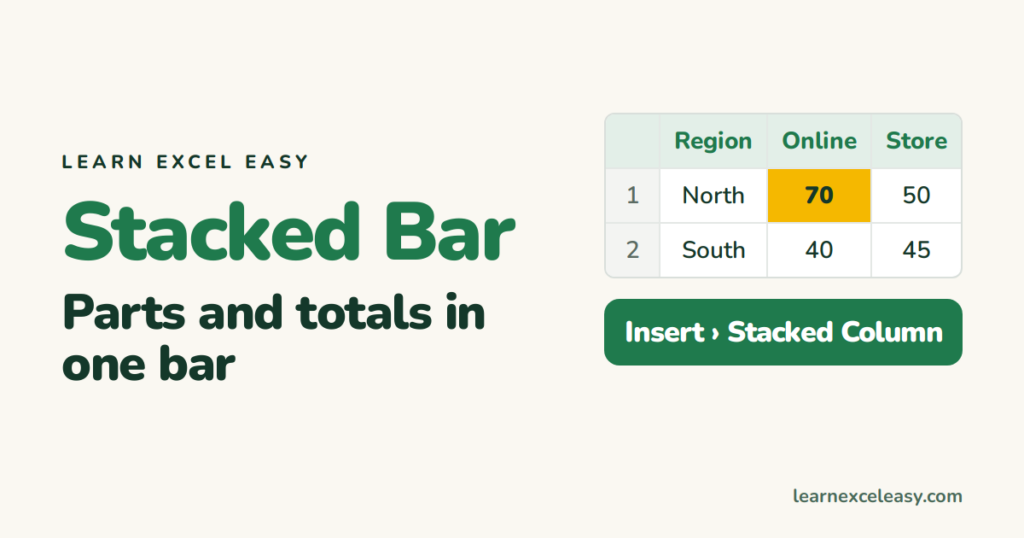
A stacked bar shows the pieces that make up each total — online plus store sales per region — stacked end to end.
Steps
- Categories in column A, one column per part (Online, Store), headings in row 1.
- Select A1:C4.
- Insert › Charts › Column › Stacked Column (or Bar › Stacked Bar for horizontal).
- Title it.
Show the total on top of each bar
Excel has no total-label option, so add one:
- Add a Total column:
=B2+C2, drag down. - Right-click chart › Select Data › Add › the Total column.
- Right-click the new Total bars › Change Series Chart Type › set Total to Line.
- Click the line › + › Data Labels › Above. Then click the line › Ctrl + 1 › Line: No line.
Totals float above each stack, line invisible.
Shares instead of amounts
Change Chart Type › 100% Stacked Column. Every bar is full height; segments show percentage of each region’s total.
Check it worked
North’s bar should be 120 tall (70 + 50). Hover a segment: the tooltip shows its value.
When not to stack
Comparing Online across regions is hard when Online is not at the bottom of every stack. If comparing the parts matters more than the totals, use Clustered Column instead.

20 years with spreadsheets and enterprise systems. Writes one short, plain-English Excel lesson a day. Got an Excel question? learnexceleasycom@gmail.com
